Visualizing years of messaging on Facebook
Data visualization Python Facebook
Back in winter 2016, I have discovered /r/DataIsBeautiful (and /r/DataIsUgly) and when the holidays came, I’ve set the goal of learning D3.js and creating a nice visualization myself. I saw a reddit post and immediately thought that was something I wanted to try to replicate. It took me few full days of learning, but I was really happy with the result.
As of now, more than 4 years have passed and it would be interesting to see how my messaging patterns and habits changed. Unfortunately, back then I was not as careful with my side projects as I am now, and I lost all the code. Moreover, I (happily) haven’t touched Javascript for a few years now, and I am hoping to continue with that. For my 2021 spring vacation, I’ve set a goal of redoing the visualization in Python, with new data and document everything properly for a blog post, and hopefully finding something new along the way. If you are reading this on my website, the experiment is a success!
Downloading Facebook data
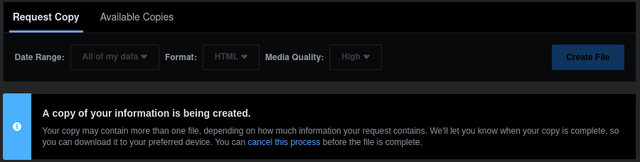
First, we need to obtain the messaging data. Few years ago I had to use some third-party scripts that would scroll through my messages and save them one by one. The technology (or more precisely, enforcement of GDPR) moves forward and now Facebook provides a nifty tool with which you can download the data directly. Go to facebook.com/dyi, select Messages, JSON format and press Create File. Depending on the amount of messages you have, it will take anywhere between half an hour and a day to receive the download link.
While not needed for this project and would probably take longer to create data archive, I highly recommend to request all of the possible data, not just messages. It is quite eye opening to see how much exactly information Facebook collects, and not just on their websites, but from third parties, even when you are not logged in.
Parsing and filtering messages
Messages are stored in message_*.json files in messages folder of your Facebook data archive. Let’s read all of them (and fix facebook’s mojibake) and make a list of all messages that we can find:
import json
from pathlib import Path

# fix mojibake: https://stackoverflow.com/a/62160255/1668421
def parse_obj(obj):
    if isinstance(obj, str):
        return obj.encode('latin_1').decode('utf-8')

    if isinstance(obj, list):
        return [parse_obj(o) for o in obj]

    if isinstance(obj, dict):
        return {key: parse_obj(item) for key, item in obj.items()}

    return obj

message_files = [f for f in Path('path/to/messages/folder').rglob('message_*.json')]
messages = []
for m in message_files:
    with open(m, 'r') as f:
        messages += parse_obj(json.load(f)['messages'])
Each element of messages is a dictionary and depending on the type, fields can differ. In my archive I have found five types:
>>> set([m['type'] for m in messages])
['Share', 'Subscribe', 'Unsubscribe', 'Generic', 'Call']
Of these five, I am interested only in Share (sending links) and Generic (chat messages). Subscribe and Unsubscribe seem to be used only for Facebook bots, while Calls are self-explanatory.
messages = list(filter(lambda d: d['type'] in ['Share', 'Generic'], messages))
Let’s inspect those messages and see how many unique fields I have in my data and whether they are always populated. I have to note that this is what I have in my data. It is probably not the full list of all possible fields and YMMV.
fields = list({field for message in messages for field in message})

# There is definitely a one-line list comprehension that can replace this snippet
counter = dict.fromkeys(list({field for message in messages for field in message}), 0)
for f in counter:
    for m in messages:
        if f in m:
            counter[f] += 1

>>> {f: counter[f] == len(messages) for f in counter}
{
    'files': False,
    'content': False,
    'timestamp_ms': True,
    'videos': False,
    'gifs': False,
    'photos': False,
    'reactions': False,
    'audio_files': False,
    'type': True,
    'is_unsent': True,
    'ip': False,
    'sticker': False,
    'sender_name': True,
    'share': False
}
It seems that fields timestamp_ms, is_unsent, sender_name and type are the only ones that are populated all messages.
Now, let’s filter by time range, for example let’s filter out messages that are are not from 2020. Note, Facebook stores timestamps in milliseconds.
import time

time_from = time.mktime(time.strptime('01/01/2020', '%d/%m/%Y')) * 1000
time_to = time.mktime(time.strptime('01/01/2021', '%d/%m/%Y')) * 1000

messages = list(filter(lambda d: (d['timestamp_ms'] > time_from) and (d['timestamp_ms'] < time_to), messages))
Messaging heatmap
Now that we have only the messages we need for the visualization, let’s recreate the graph that I mentioned before with Pycairo, Python bindings for cairo graphics library. The API is pretty similar to D3.js and quite pythonic (I think I will use Pycairo again in the future!). The toughest part was basic trigonometry for finding correct coordinates on the circle and tweaking sizes and offsets to make it look better.
In short, the algorithm for drawing is following:
- Draw background circle
- Draw inner circles, month delimiters and month names
- Draw inner text
- For each message:
- Convert message’s timestamp to the day of the year and a fraction of the day
- Draw a small semi-transparent stroke on the circle in the appropriate day of the year and time of the day
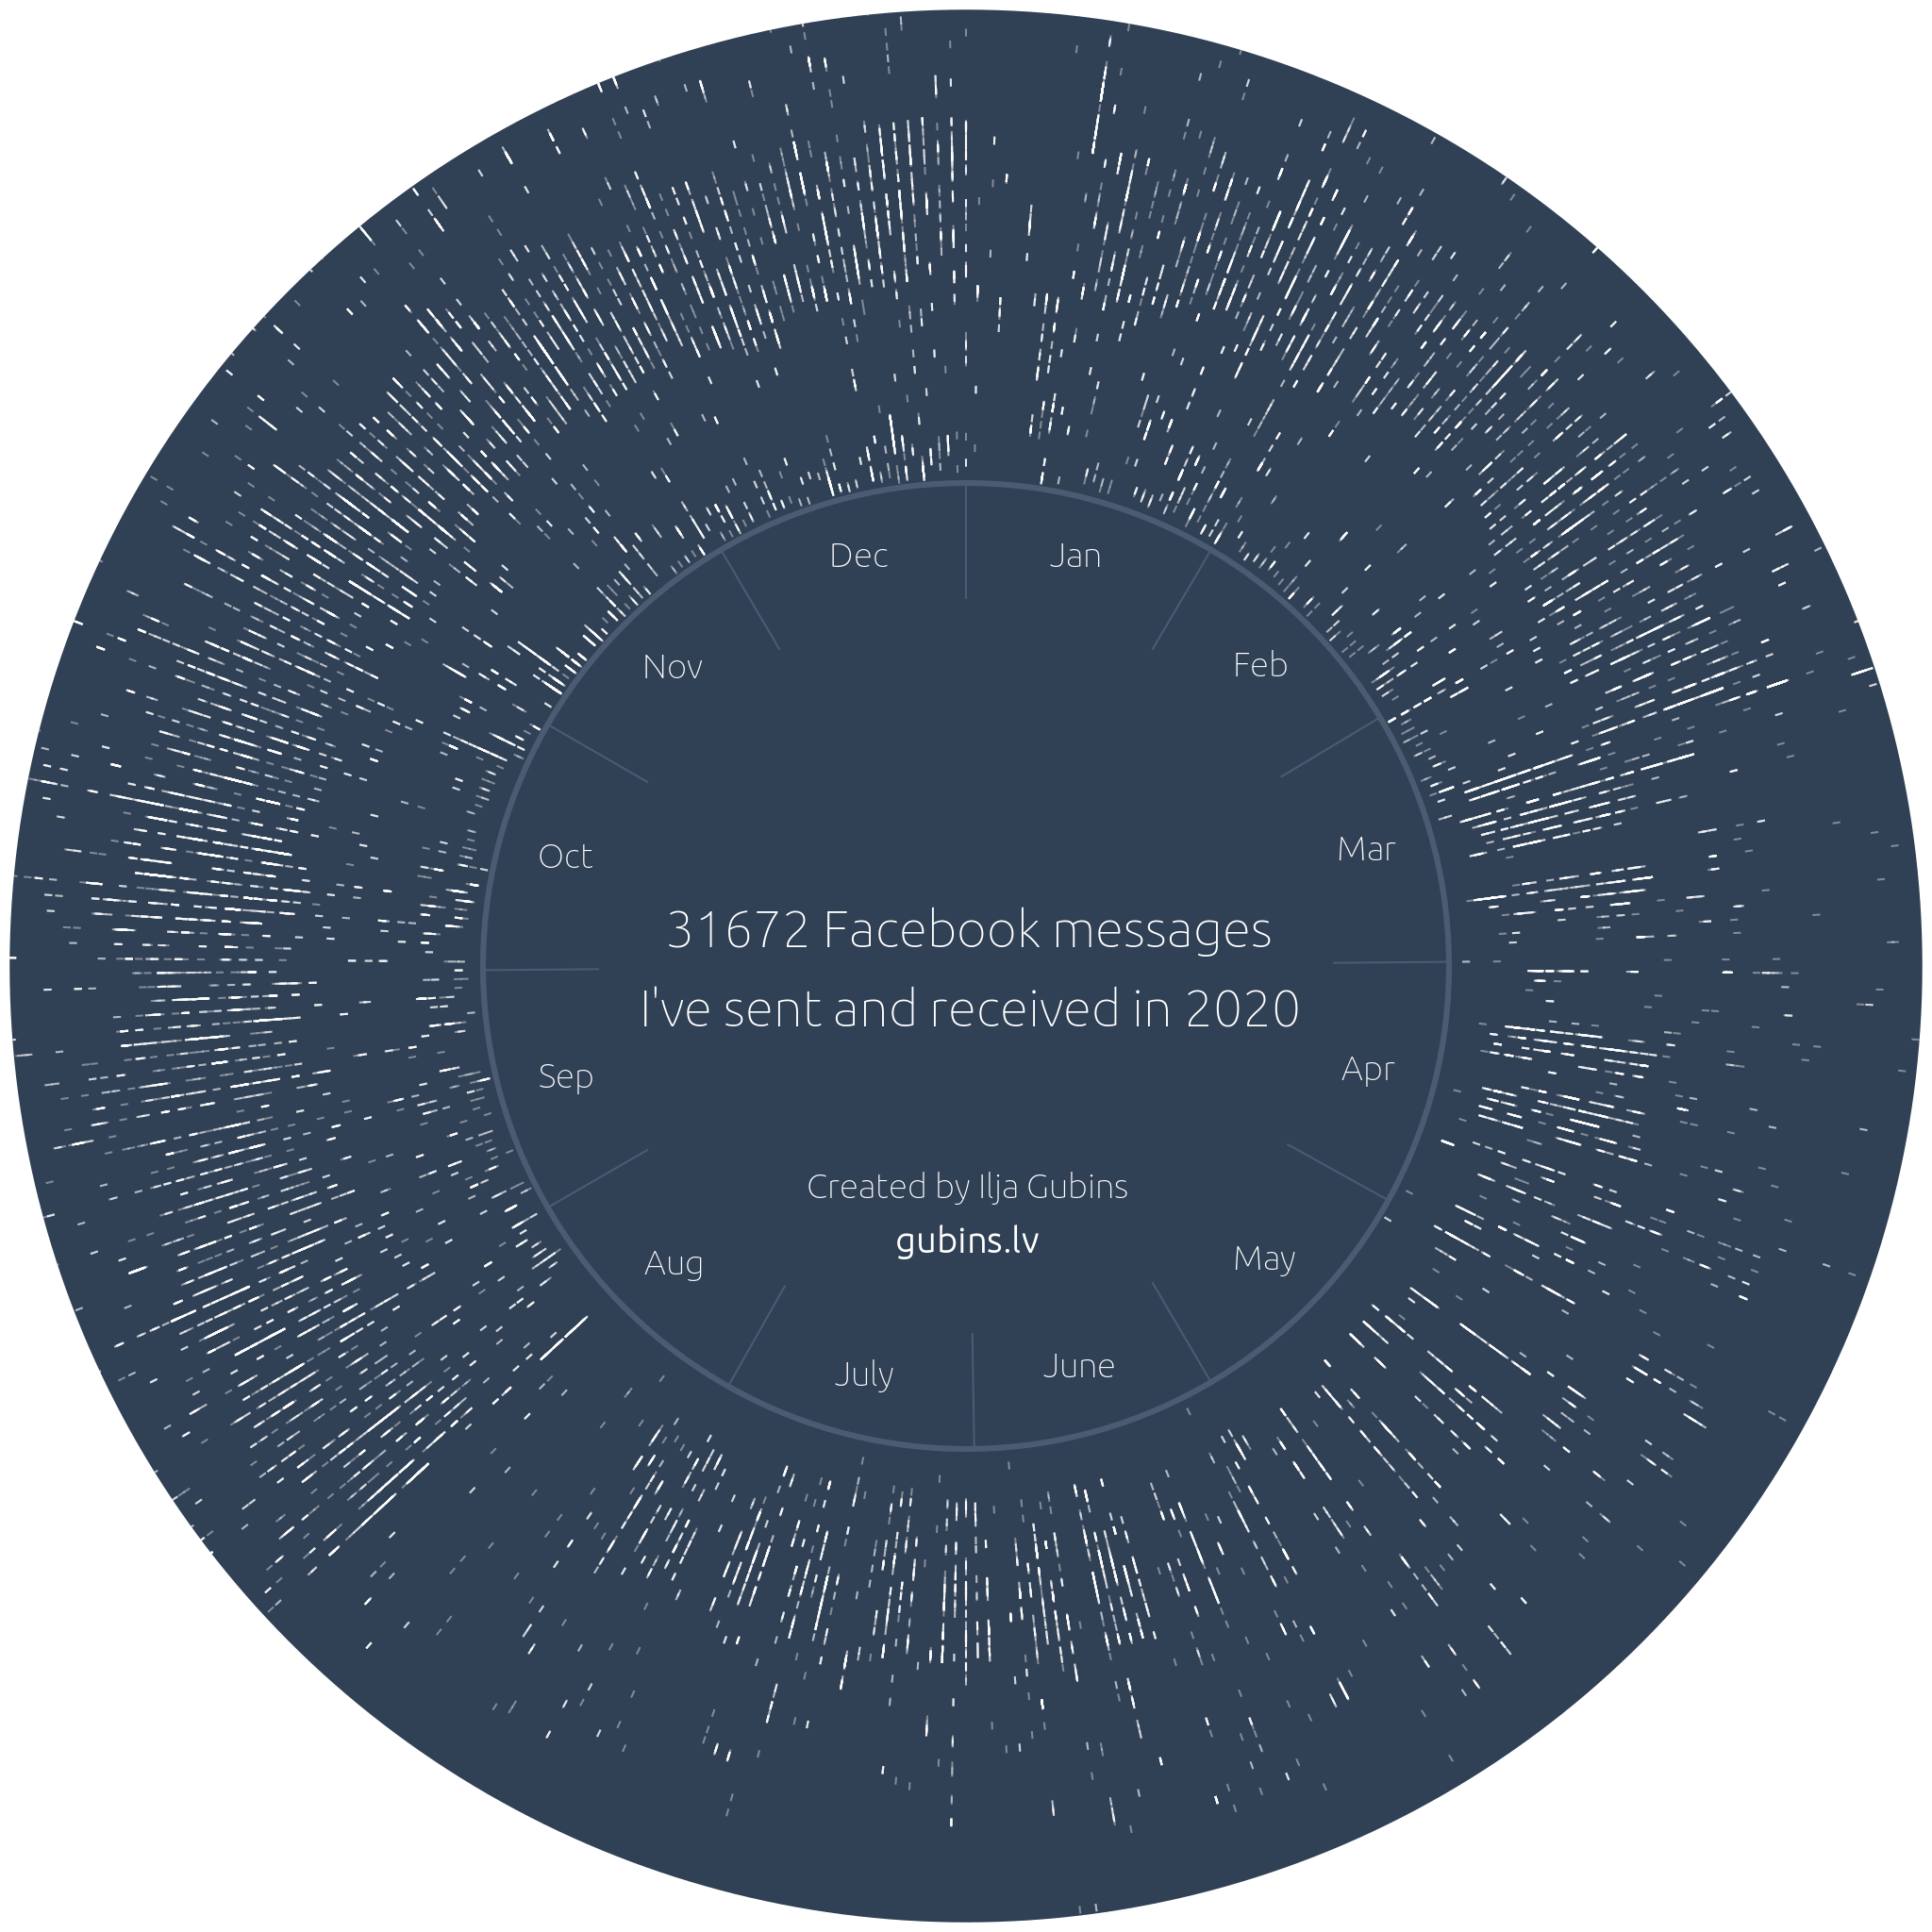
2020 was a very unusual year for all of us. I was lucky enough to (happily) get stuck in Japan with my girlfriend, essentially maxing out tourist visa and staying there for almost 6 months. This is clearly visible on the heatmap: I left for Japan mid-March and returned back home mid-August.
Analyzing messages data
While my initial goal was to recreate the heatmap, I have decided to try to find some other information in the messages data.
Unique people you have chatted with:
len(set([m['sender_name'] for m in messages]))
How many unsent messages you have in your chats:
len([m for m in messages if m['is_unsent']])
How many reactions you and your friends have put:
len([m for m in messages if 'reactions' in m])
Message content
Since the content of the message is also included, you can even further and analyze the messages themselves. For example, we can count occurences of every word:
from collections import Counter
import string

c = Counter()
for m in messages:
    if 'content' in m:

        # remove punctuation
        content = m['content'].translate(str.maketrans('', '', string.punctuation))

        # count occurences in lowercase
        for w in content.split():
            c[w.lower()] += 1
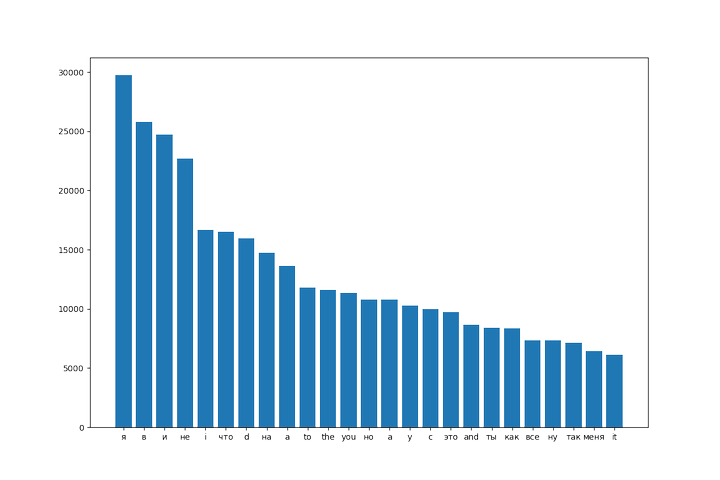
Later, we can make a bar plot of 25 most common words:
import matplotlib.pyplot as plt
mc = c.most_common(25)
plt.bar([x[0] for x in mc], [x[1] for x in mc])
plt.show()
It doesn’t really follow Zipf’s law, which states that frequency of any word is inversely proportional to its rank, but it is reminiscent of a log graph and heavy-tailed as expected.
Location data
Another interesting discovery is that Facebook seem to save IP addresses from where I logged in to Messenger. According to DYI their info page, they call it “Your recent message activity from specific IP addresses”.
How many unique IPs facebook has seen you message from:
set([m['ip'] for m in messages if 'ip' in m])
Going further, you can find approximate location of each of the IP address with tools like ipinfo.io, which recently launched bulk upload tool. Plotting those locations on the world map, you get something like this:
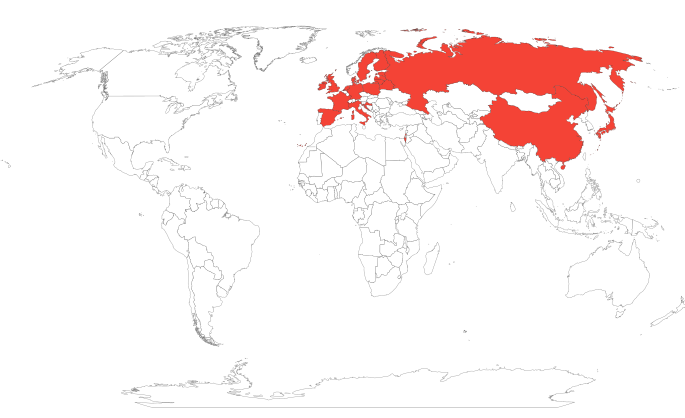
– Ilja